With ETH and BTC in the limelight, altcoins like Tezos and Litecoin could see further gains
Litecoin, Ripple and Tezos are among altcoins to see a minor drawdown in prices this Friday morning. But contextualised against the broader crypto market, sentiment looks to be positive as traders eye new moves.
Here's a brief perspective on the technical outlook for Litecoin (LTC), Tezos (XTZ), and Ripple (XRP) ahead of Friday's $625 million BTC options expiry.
Tezos price
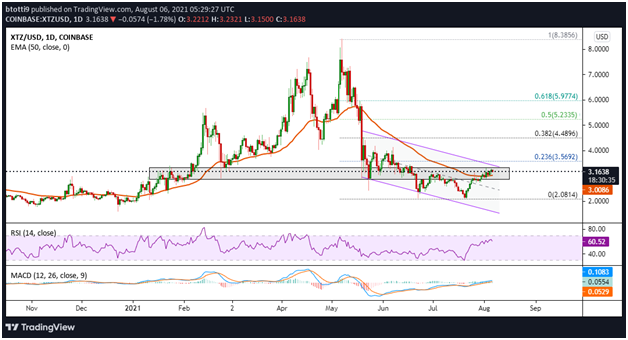
XTZ price is trading near a critical resistance zone that has previously contributed to the overall price direction of the coin since the 37% crash on 19 May. The price ceiling is around $3.31 on the daily chart, which keeps XTZ/USD within a large descending channel. 
XTZ daily chart. Source: TradingView
Technicals (the daily RSI is above 60 and the daily MACD has formed a bullish crossover) suggest the short-term outlook favours fresh upside moves.
If bulls breach the resistance line of the channel, targets in the next few days would be at the 23.6% Fib level ($3.57) and the 38.2% Fib level at ($4.49).
On the downside, bears can target the 50 EMA ($3.00) and the horizontal line around $2.08.
Litecoin price
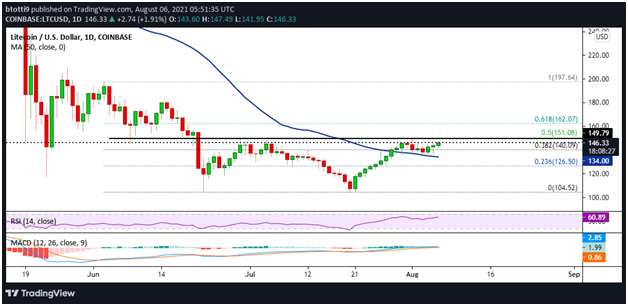
LTC/USD is looking to extend gains above $140 after a decent bounce to intraday highs of $147. The RSI is near the overbought territory, while the MACD on the daily chart is beginning to increase in the bullish zone.
The 50% Fib retracement level ($151) and the 61.8% Fib retracement level ($162) provide the next two major resistance zones. If the price clears above these hurdles, bulls could eye $180 and then $200. 
LTC/USD daily chart. Source: TradingView
On the downside, bids below $140 could encourage bears to target the 50 MA ($134) and the crucial zone near the $130 level. A break to the 23.6% Fib level ($127) could see LTC/USD refresh losses to $120.
Ripple price
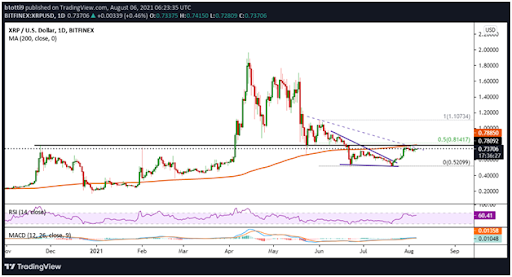
XRP bounced off the $0.52 support level on 21 July and rose to highs of $0.77, testing the 200 MA. The zone is also home to a long-term resistance line from November 2020, which is putting pressure on the bulls. 
XRP/USD daily chart. Source: TradingView
However, the RSI and the MACD offer bullish signals, suggesting buyers are in charge short term. Also, the appearance of a bullish flag pattern on the daily chart suggests bulls might break above the 200 MA ($0.79) and target new momentum above the 50% Fibonacci retracement level ($0.81) and then $0.91.
On the flipside, primary support is at $0.70, $0.62 and $0.51.
The post Weekend Price Outlook: Tezos (XTZ), Litecoin (LTC) and Ripple (XRP) appeared first on Coin Journal.

0 Comments